


Ever spent an hour hopping between your TV and phone, trying to pick something good to watch? That’s information overload. You’ve got all the content in the world, but still no idea what to choose.
Now imagine that same kind of chaos at work. Dashboards everywhere. Reports piling up. Millions of rows of data, and you still don’t know what’s actually important.
That’s what happens when you’ve got data with no direction.
But plug in the right analytics tools, and all that noise starts to make sense. You can instantly spot patterns, identify root causes, and make faster, smarter decisions.
Want to see it in action? This guide is your launchpad.
Table of contents:
Data analytics is the process of collecting, cleaning, and analyzing data to find valuable insights that support better decision-making.
It combines several techniques, such as statistical analysis, machine learning, data mining, and visualization, to process huge volumes of information in real-time.
The goal?
Turn scattered data into strategic action.
Let’s say revenue suddenly drops. Instead of waiting for reports, you can dig into the data. Maybe a product glitch is turning customers away, or maybe your latest campaign triggered a negative response. With analytics, you can see exactly what’s going on and what steps to take next.
Analysis is just the tip of the iceberg.
It’s the part where you take cleaned, prepared data and start examining it, looking for patterns, trends, or answers to a specific question. Think of it as the act of interpreting what the numbers are saying, often through reports, summaries, or visualizations.
But analysis alone isn’t enough; it’s just the final layer of a much deeper system.
Data analytics is the full engine behind that system. The process starts with how data is collected, stored, and engineered. Then comes modeling, visualization, and operationalization. Together, this process helps you discover the right insights with more context.
Here’s how their scope and direction differ:
| Feature | Data Analysis | Data Analytics |
|---|---|---|
| Scope | Helps interpret the ‘what’. Tells you what happened—like a drop in revenue or spike in churn. Focuses on known patterns to answer specific, one-off questions. |
Goes beyond the ‘what’. Connects collection, modeling, and action in a full-cycle approach. Explains why something happened, what might happen, and what to do. |
| Direction | Looks backward—analyzing past events and patterns. | Looks ahead—predicts outcomes and informs future decisions. |
The key benefits of data analytics include:
Give customers what they actually want
Make data-backed decisions
Spot what’s slowing you down
Stay ahead with predictive insights
Give customers what they actually want
Want to know what your customers want? You already have the receipts.
With data analytics, you can track exactly how customers move through your website or app. Think funnel analysis, segmentation, or even churn prediction—these tools help you map the entire user journey, from the moment they land on your site to the moment they hit buy.
Once that path is clear, you can spot friction points, identify what’s working, and personalize the experience in ways that boost conversions.
Make data-backed decisions
When timing is everything, waiting days for reports means losing business.
With real-time analytics, you get instant visibility into what’s working, what’s not, and what needs your attention right now.
Whether you're launching a new campaign or prioritizing product features, real-time dashboards help you weigh options, simulate outcomes, and move faster, with far less risk.
Spot what’s slowing you down
It only takes one late delivery or missed approval to throw your entire operation off track. That’s why using your analytics the right way is no longer optional; it’s essential.
Techniques like data mining break down your operations layer by layer, exposing hidden patterns, dependencies, and weak links you’d otherwise miss.
Once those gaps are visible, you can fix them fast, recover lost time, and keep everything moving at full speed, before small issues turn into costly problems.
Stay ahead with predictive insights
Markets shift fast. By the time you react to a shift in customer behavior, your competitors could already be two steps ahead.
That’s where predictive insights give you the upper hand. They give you the power to spot trends before they become headlines. By leveraging machine learning algorithms, you can anticipate what your customers will want next, where demand is building, and which risks are starting to take shape.
This isn’t just smart planning, it’s how you stay ahead in a crowded market.
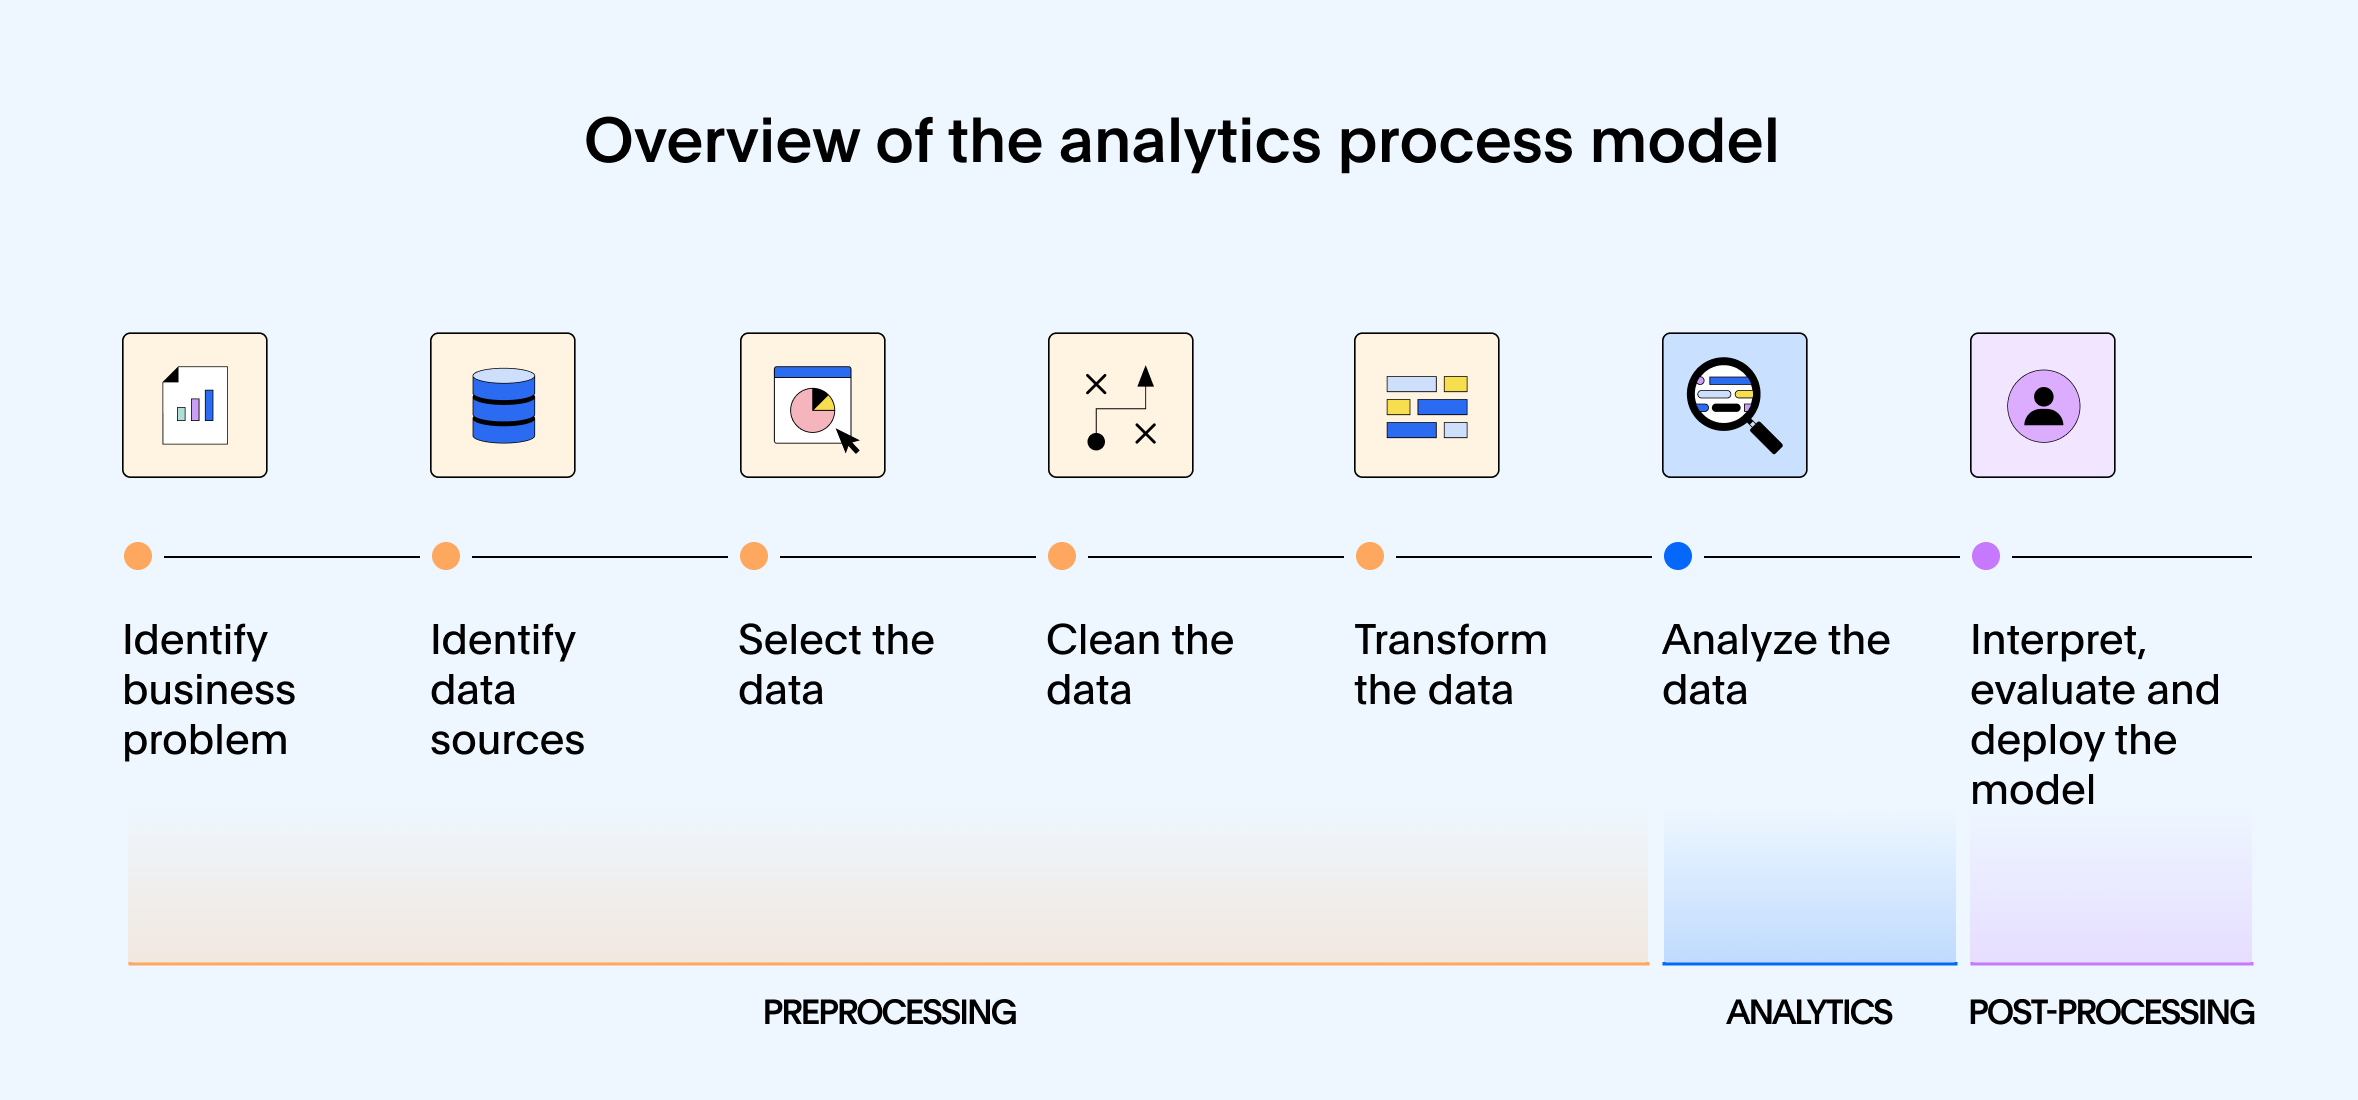
Step 1: Data collection
Every great decision starts with the right data. From tracking how customers move through your website to logging in-store purchases, data collection is where insight starts. The better the data you capture, the faster you get your insights.
But raw data isn’t always reliable. Messy, inconsistent, or incomplete data can throw everything off. That’s why data cleaning is critical. By removing errors and standardizing formats, you make sure the data you're using is actually trustworthy.
Step 2: Data integration
Once your data is clean, the next step is breaking down silos. Most businesses store data across multiple platforms, such as CRM systems, marketing tools, and finance apps.
If this data stays disconnected, you’re only seeing part of the picture.
Data integration combines all those sources into a centralized system so your team is always working with complete, structured, and analysis-ready data.
Step 3: Data exploration
With clean, connected data in one place, it’s time to dig in. Exploration is the process of reviewing datasets to spot patterns, relationships, and anomalies before deeper analysis begins. It’s the stage where you start asking questions, such as why conversions spiked in one region or whether seasonality is impacting churn.
This step validates your assumptions, discovers red flags, and shapes the direction of the analysis that follows.
Step 4. Data analysis
Exploration often reveals gaps, outliers, or interesting correlations—but now it’s time to go deeper.
This is where advanced analytics techniques come into play. For instance, you might run a regression analysis to understand what’s driving churn, build a forecast to anticipate future sales, or use clustering to identify new customer segments.
This is the point where you start turning data into real insights.
Step 5: Data visualization
Data only drives value if it’s understood. That’s why visualization is important. Well-designed dashboards and visual summaries turn complex data into clear, actionable stories.
With the right visuals, your team can quickly grasp what’s happening, why it matters, and what to do next.
Data analytics is not a one-size-fits-all approach. There are four main types of data analytics, each serving a distinct purpose:
1. Descriptive analytics: What has happened
Descriptive analytics helps you make sense of what’s already happened. It’s your go-to tool for understanding past performance, spotting trends, and identifying where deeper analysis is needed.

What it typically involves:
KPI tracking: Monitor key metrics like churn, revenue growth, or daily active users. It helps you spot trends, track progress, and benchmark performance over time
Dashboards and reports: Get a high-level view of what’s going on across your business. Visual dashboards surface key trends and performance gaps instantly.
Data summarization: Apply statistical methods such as mean, median, and mode to break down large datasets into clear, digestible insights.
Historical perspective: Track performance over time, whether it’s monthly or yearly, to identify seasonal patterns, growth plateaus, or unusual shifts.
2. Diagnostic analytics: Why it has happened
Diagnostic analytics is exploring your data to understand the ‘why’ behind past outcomes. It goes beyond simply reporting what happened, allowing you to investigate patterns, discover anomalies, and identify root causes.
It’s how you move from just reporting outcomes to truly understanding them.
And when paired with an AI Analyst like ThoughtSpot Spotter, you can get to the ‘why’ even faster. Here’s how it plays out in real life:
What it typically involves:
Root cause analysis: Go beyond surface-level metrics to discover what actually led to a spike, dip, or unexpected behavior. This is where you start connecting the dots and pinpointing the exact cause behind performance shifts.
Correlation and causation: Find out which variables are truly influencing outcomes and causing change.
Comparative analysis: Compare datasets by categories, such as different time periods, regions, or customer cohorts, to identify hidden relationships in your data.
Hypothesis testing: Test assumptions and validate theories with data, so you act on facts.
3. Predictive analytics: What will happen
Predictive analytics helps you look ahead. It uses historical data and machine learning to forecast what’s likely to happen, so you’re not just reacting to changes, but actually preparing for them.
What it typically involves:
Statistical modeling: Train models on your past data to predict future outcomes, such as purchase behavior, churn risk, or lead conversion likelihood.
Data mining: Scan large datasets to find hidden signals and behavioral patterns that traditional analysis might miss.
Probability scoring: Assign likelihoods to key events, so your team knows what to prioritize and where to focus resources.
Forecasting: Leverage time-series analysis to project growth, demand, or risk based on historical trends and seasonality.
4. Prescriptive analytics: What can we do next
Prescriptive analytics gives you actionable guidance on what to do next and why.
Using a mix of historical data, statistical methods, and real-world constraints, prescriptive analytics recommends the best path forward. It’s what turns analysis into strategy.
What it typically involves:
Optimization models: Suggest the most effective course of action, like how to allocate budget, price a product, or route inventory for maximum ROI.
Advanced algorithms: Use machine learning and optimization techniques to personalize recommendations and improve them over time.
Scenario planning: Considers various ‘what if’ scenarios, so you can understand how different actions impact your business.
1. Getting better pipeline visibility
You’ve probably seen this before: on paper, your pipeline looks solid. Lots of leads and plenty of meetings. But for some reason, deals just aren’t moving.
Instead of doubling down on cold calls, you start digging into your sales data. And soon enough, you find the culprit: your team is chasing webinar signups, while high-intent users—like those who started free trials—are getting ignored.
With real-time analytics, you can finally see where momentum is building and where it’s being wasted. The result? More relevant conversations, faster deal cycles, and fewer missed opportunities.
2. Pivoting your campaign
Most campaigns follow a familiar rhythm: build hype, go live, watch the traffic roll in. But sometimes, despite the clicks, conversions stall.
Once you dive into your analytics, you can see that mobile bounce rates are spiking. One layer deeper, and there it is: the CTA button isn’t loading on Android.
Without that insight, you might’ve wasted hours testing headlines or reworking creatives. But now? You know exactly what’s wrong.
3. Identifying revenue leaks
Your revenue dashboard might say everything’s on track. But somehow, you notice your cash reserves are dipping.
Without deeper analytics, you might chalk it up to timing or seasonality. But with advanced analytics tools, you start peeling back the layers.
You spot a spike in vendor payments over the last two cycles. Drill down further, and diagnostic analysis reveals the real issue: several key clients have invoices overdue by more than 45 days.
There’s your leak.
Now, imagine skipping the manual digging entirely. With an AI Analyst like Spotter, you don’t need spreadsheets or SQL. Just ask ‘Why is revenue down this month?’ and get a clear, actionable answer in seconds.
See how it works in real life:
Investing in a data analytics platform isn't just a tech decision; it’s a business-critical one.
The right tool helps you create a data-driven culture. The wrong one? It becomes shelfware, used only by a few analysts.
If your goal is to empower everyone with actionable insights, here’s what to actually look for in a modern analytics tool:
| What to Consider | Evaluation Question | Why It Matters |
|---|---|---|
| Ease of use | Can business users explore data and get insights on their own? | Democratizing data makes insights accessible to everyone, not just experts. |
| Real-time analytics | Does it refresh automatically, and can it handle live data feeds? | Some decisions can’t wait. If your dashboards are outdated, you will miss capitalizing on emerging opportunities. |
| Advanced analytics | Can it forecast trends, spot outliers, or plug into machine learning models? | You want to know what’s next, not just what already happened. That’s how you stay ahead. |
| Data connectivity | Will it connect to your cloud warehouse, spreadsheets, APIs, and CRM systems? | Your data lives everywhere. You need a data analytics tool that brings it all together in one view. |
| AI features | Are automated insights, anomaly detection, or natural language queries built in? | Turns passive charts into active decision engines. |
| Interactive dashboards | Can users drill down, filter, and personalize dashboards on the fly? | By drilling into your charts and graphs, you can better identify trends and patterns. |
| Embedded analytics | Can you put charts or dashboards inside your app? | Great for monetizing your data and creating a seamless data experience for your customers. |
💭 Too many tools, not enough clarity? Here's your guide to finding the right data analytics software that fits your team.
Seeing the problem isn’t the same as solving it
Traditional data analytics is broken. You’re stuck with static dashboards, reports, and a long line of follow-up requests just to explore deeper. The insights exist, sure, but by the time you act on them, it’s too late.
With ThoughtSpot’s Agentic Analytics Platform, insight turns into action. Ask questions in natural language, get automated insights, model your data, and drill into what really matters, with zero dependency on analysts.
This is the era of agentic analytics, where answers get delivered within seconds, and action follows instantly.
Try ThoughtSpot for yourself today.
What’s the future of data analytics?
The future is all about real-time insights, AI-powered analysis, and making data actionable for everyone, not just data teams. According to Gartner, you can expect a rise in natural language queries, predictive analytics, and autonomous agents that can analyze, explain, and even act on data.
What are the top skills to succeed in data analytics today?
Here’s what’s in demand right now:
Data storytelling: Making insights understandable and actionable
SQL & Python: For querying and automation
Data visualization: Using tools like ThoughtSpot or Power BI to show insights clearly
Business acumen: Knowing which metrics actually matter to the business
AI literacy: Understanding how tools like machine learning or generative AI assist in analysis
Soft skills are just as valuable as technical ones, especially if you want to move from analyst to strategist.
How do I actually use data analytics in my day-to-day work?
With a powerful AI Analyst like Spotter, you can type a simple query, such as ‘Why did my churn drop last week?’ and instantly see trends, root causes, and next steps. Such actionable insights that help you act faster, whether you’re launching a new campaign or driving efficiency across operations.
What are the most commonly used data analytics techniques?
It really depends on your use case. If you're tracking performance or KPIs, descriptive analytics works best. Techniques like anomaly detection are popular in operations and finance to catch outliers early, and segmentation is a go-to in marketing. The right approach depends on the question you’re asking—and how fast you need the answer.


