


For over three decades, we’ve talked about the potential of data analytics. And while the tools have gotten smarter, many businesses still struggle to extract real-time insights or act fast enough to keep up with shifting demands.
Why?
Because too many organizations treat data analytics as a one-size-fits-all solution. They end up with clunky dashboards, static reports, and insights that don’t move the needle. According to Accenture, 81% of companies still lack a clear enterprise data strategy. That’s a lot of missed opportunities.
The fix?
Stop relying on legacy approaches. When you match the right type of analytics to the right problem and use agentic AI tools that let you search data in plain language, you can make faster, smarter decisions.
Table of contents:
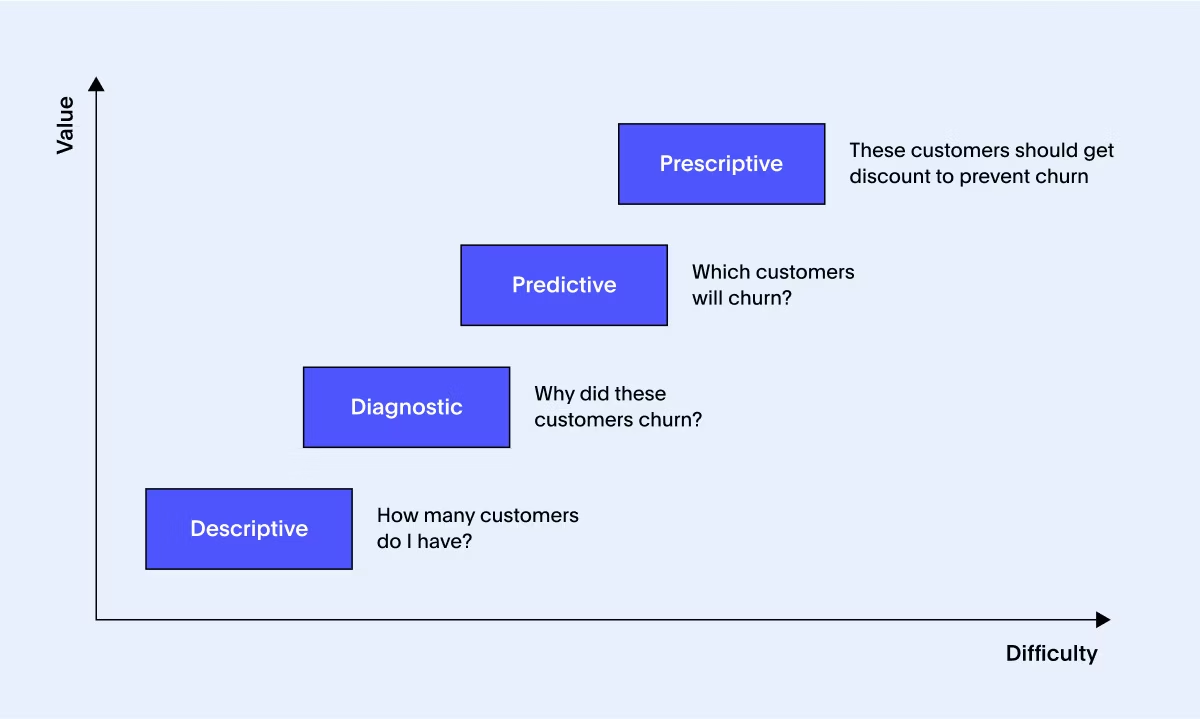
To see how the different types of analytics work in practice, let’s take a common business problem: employee churn.
Imagine you’re an HR leader trying to reduce attrition across the company. Here's how each type of analytics would come into play:
Descriptive analytics tells you what’s happening right now. You might start by pulling up metrics like attrition rate by department, tenure at exit, or exit reasons from surveys. This gives you a factual baseline: where are you losing people, and how often?
Diagnostic analytics digs into why it’s happening. Maybe churn is higher in the sales team, but not in marketing. A closer look reveals that sales reps are citing unclear career paths or burnout from quota pressure. Now you’re not just looking at numbers, you’re getting context.
Predictive analytics helps you look ahead. Based on historical patterns like tenure, performance scores, and engagement survey results, you can build a model to flag which employees might be at risk of leaving in the next few months.
Prescriptive analytics is where you shift from insights to action. Say your model identifies a cluster of high-risk employees. Prescriptive tools can recommend actions like adjusting compensation bands, offering internal transfers, or launching targeted engagement programs, along with the likely impact of each move.
Each type gives you a different level of understanding. Used together, they don’t just tell you what happened, they help you make smarter decisions about what to do next.
Let’s break each one down further.
Descriptive analytics helps you answer: “What’s happening?” or “What already happened?”
It summarizes historical data to give you a clear, digestible snapshot of past performance, often in the form of charts, tables, dashboards, or interactive reports. It’s the foundation of data analysis, and usually the first step when trying to understand trends or patterns.

How it works
Step 1: Define what you want to analyze
Step 2: Gather relevant data
Step 3: Clean and prepare your dataset
Step 4: Summarize using statistical techniques
Step 5: Visualize findings with BI tools like ThoughtSpot
Real-world examples
Understanding customer behavior: You’ve got survey results, support tickets, and user activity data piling up. Descriptive analytics helps turn that chaos into clarity. You might discover that customers consistently struggle with onboarding or that a particular feature is driving the most engagement, insights that can shape product updates and improve experience across the board.
Tracking financial performance: Descriptive analytics is a go-to for finance teams looking to keep tabs on revenue, expenses, and margins. Whether you’re reviewing quarterly performance or comparing this year’s spend to last year’s, it gives you the context you need to make smarter budget decisions and spot unusual patterns early.
Monitoring supply chain efficiency: From delivery timelines to vendor reliability, descriptive analytics brings much-needed visibility into supply chain operations. By looking at historical trends, teams can pinpoint what’s slowing things down, flag recurring disruptions, and find ways to streamline everything from inventory planning to logistics.
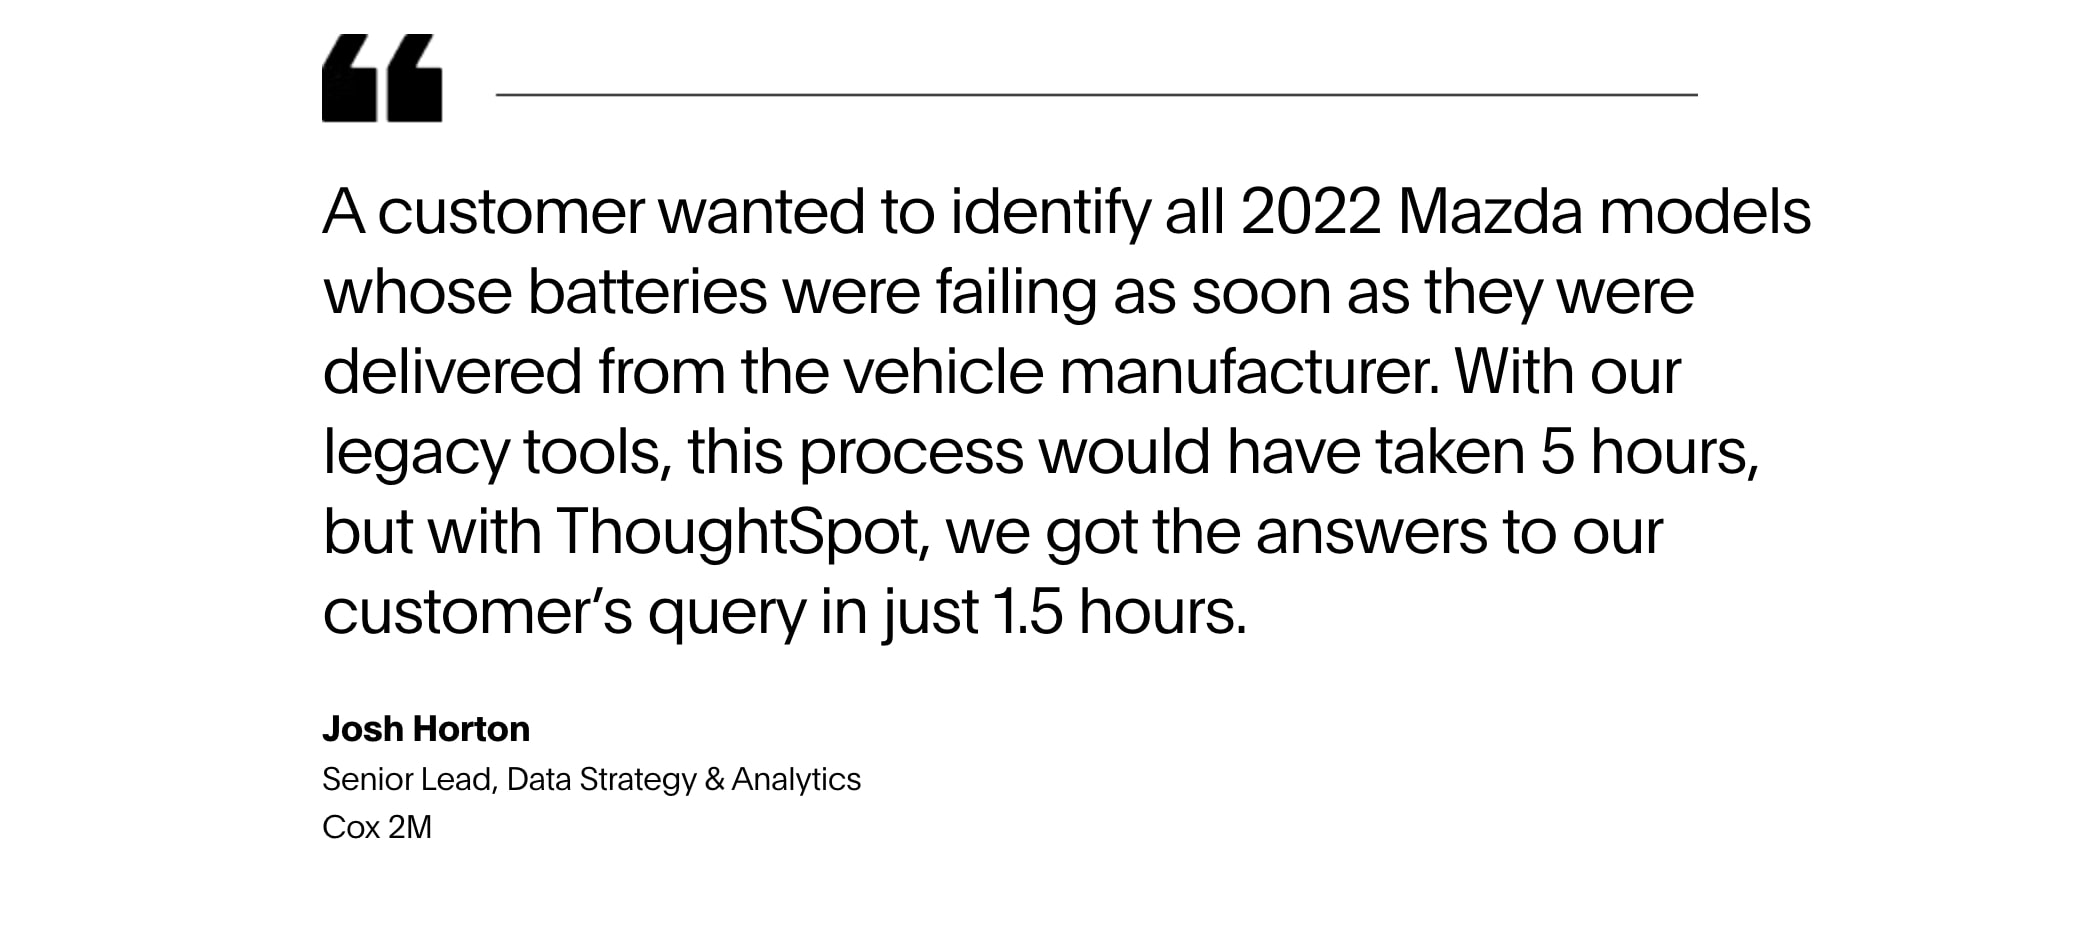
Cox 2M used ThoughtSpot to cut time-to-insight by 76% and reduce reporting costs by $70K. Instead of waiting on static dashboards, teams now get answers instantly using AI-powered search and contextual insights generated by SpotIQ.
Predictive analytics helps you answer: “What’s likely to happen next?”
It uses patterns in historical data, combined with statistical models and machine learning algorithms, to make informed guesses about future outcomes. It’s not a crystal ball, but it’s a powerful way to anticipate trends, risks, or opportunities before they hit.
How it works
Step 1: Define the problem
Step 2: Collect relevant historical data
Step 3: Clean the data
Step 4: Choose a modeling technique (e.g., regression, time series, clustering)
Step 5: Train and test your model
Step 6: Apply insights to real-world scenarios
Real-world examples
Inventory planning: You’re launching a new product. How much should you stock? Order too little and you risk stockouts and missed sales. Too much, and you’re stuck with inventory you can’t move. Predictive analytics helps you forecast demand based on past trends, seasonality, and even local buying patterns so you can make sharper calls and keep your shelves balanced.
Fraud detection: As scams get more sophisticated, financial institutions are turning to predictive analytics to stay ahead. By analyzing transaction patterns, behavioral signals, and historical fraud data, banks can flag anomalies before damage is done, saving time, money, and customer trust.
Macquarie Bank is one example. Rather than relying on reactive methods, the data team led by Chief Data Officer Ashwin Sinha is taking a proactive, two-pronged approach: educating customers while using AI and machine learning to spot suspicious activity in real time.
“What prompt engineering and GenAI broadly do is take away the low-value tasks so analysts can focus on the high-impact work.”
– Ashwin Sinha, Chief Data Officer, Macquarie Bank
🎧Listen to the full podcast here.
Sales forecasting: You don’t need to wait until the quarter ends to know things are off track. Predictive analytics can alert you when pipeline velocity slows, win rates drop, or key accounts stall. With tools like ThoughtSpot Monitor, sales leaders can track changes as they happen and shift strategies mid-quarter. Whether that means reassigning reps, reworking outreach, or doubling down on what’s working.
Prescriptive analytics helps you answer: “What should we do about it?”
It doesn’t just stop at forecasting; it gives you direction. This type of analytics combines advanced models, business rules, and scenario testing to suggest concrete next steps. It’s where analytics shifts from insight to action.
With ThoughtSpot’s AI-augmented dashboards, you don’t have to wait on custom builds or complex queries. You can simulate scenarios, explore recommendations, and drill down into key drivers, all through simple search.
How it works
Step 1: Identify the problem
Step 2: Pull together relevant data
Step 3: Build and train a recommendation model
Step 4: Simulate different scenarios
Step 5: Test, refine, and adjust
Step 6: Implement and monitor outcomes
Real-world examples
IT backlog management: When internal support queues start piling up, it’s easy for things to fall through the cracks. Snowflake tackled this head-on with prescriptive analytics. Instead of reacting ticket by ticket, they used data to identify patterns, prioritize the most critical requests, and reroute work more efficiently, cutting their IT backlog by 20%.
Employee upskilling: Prescriptive analytics helps HR move beyond mandatory learning modules. Instead, it surfaces personalized growth paths based on role requirements, team needs, and employee goals. So, rather than pushing blanket training programs, you’re helping each person level up in ways that actually move the needle.
Ad campaign optimization: Imagine your cost-per-click jumps from $0.50 to $20 overnight. Without the right systems, you might not catch it until the budget’s gone. Prescriptive analytics doesn't just flag the issue; it suggests how to fix it. Whether that’s pausing a campaign, adjusting bidding strategy, or reallocating spend, it turns insight into action when it matters most.
Diagnostic analytics helps you answer: “Why did this happen?”
It’s the detective work of analytics. When performance dips or unexpectedly soars, you need to know why. Diagnostic analytics digs into the contributing factors using historical data, statistical techniques, and domain context.
How it works
Step 1: Identify the event or anomaly
Step 2: Collect and clean relevant data
Step 3: Apply techniques like regression analysis, anomaly detection, and hypothesis testing
Step 4: Visualize your findings and communicate the story behind the numbers
Real-world examples
Healthcare: When patients keep coming back after treatment, doctors need to understand why. Diagnostic analytics helps analyze patterns across readmission cases, like whether certain procedures, medications, or discharge timelines are linked to poor recovery outcomes. It’s about learning from what went wrong to make better decisions going forward.
Churn analysis: If cancellation rates suddenly spike, diagnostic analytics can help pinpoint the cause. Maybe a recent pricing update frustrated long-time users, or a buggy feature started causing headaches. Instead of guessing, teams can trace behavior patterns and feedback data to get to the root of the issue.
Traffic drops: Not all performance drops are immediately obvious. Diagnostic analytics lets web and SEO teams drill into data across traffic sources, page performance, and site health to pinpoint the reason behind the decline, whether it's structural, technical, or external.
ThoughtSpot’s AI analyst, Spotter, helps you instantly surface the reasons behind anomalies, outliers, and performance shifts. Instead of manually slicing and dicing your data, you can just ask Spotter:
“Why did sales drop in the West region last week?”—and get a contextual breakdown that’s ready to act on.
Not sure which type of analytics fits your use case? Here's a cheat sheet to help you decode the differences:
| Type | Key question | Purpose | Common techniques | Example |
| Descriptive | What happened? | Summarize the past | Data aggregation, dashboards, visualizations | Monthly revenue reports |
| Diagnostic | Why did it happen? | Find root causes | Anomaly detection, regression, root cause analysis | Customer churn analysis |
| Predictive | What might happen next? | Forecast future events | Machine learning, time series, classification | Sales forecasting |
| Prescriptive | What should we do about it? | Recommend next steps | Optimization models, simulations, decision trees | Marketing campaign optimization |
Even the best data strategies can go off the rails if you’re not careful. Here are a few things to watch for:
Jumping ahead too fast: Don’t skip over descriptive and diagnostic steps. Without context, predictions can mislead.
Treating correlation as causation: Just because two metrics move together doesn’t mean one caused the other.
Overfitting predictive models: A model that performs perfectly on past data may flop when exposed to new inputs.
Ignoring data quality: Dirty, outdated, or siloed data can throw off every layer of your analysis.
Treating AI recommendations as gospel: Use prescriptive outputs as a starting point, human review still matters.
Spotter helps counter these risks by combining agent-powered insights with human-in-the-loop workflows, so teams can trust the answers they get and act on them quickly.
Data analytics isn’t just for data teams—it’s used across roles to make better decisions, faster. Here's how different teams put these types into action:
Role
Analytics they use
How they apply it
Executives
Descriptive, predictive
Track performance, set goals, allocate resources
Marketing
Diagnostic, predictive, prescriptive
Understand campaigns, forecast pipeline, optimize spend
Finance
Descriptive, predictive
Monitor cash flow, model risk, forecast revenue
Ops/IT
Descriptive, prescriptive
Manage tickets, streamline workflows, reduce downtime
Data teams
All four
Build models, uncover insights, guide business strategy
Whether you’re just getting started or looking to level up, here’s how to make your analytics stack actually useful:
If you're new to this:
Start with clean data. It’s not the flashiest step, but it’s the foundation everything else depends on.
Use descriptive analytics to understand what’s already happened and establish your baseline metrics.
Once you’ve got that down, start asking “why” things happened and “what might happen next.”
If you're ready to go further:
Focus on impact. Look for pain points like churn, sales slowdowns, or operational bottlenecks.
Bring in predictive analytics where past patterns can help forecast what’s ahead.
Use prescriptive analytics when you need a clear recommendation, not just a trend.
Skip the dashboard drag. With ThoughtSpot’s agent-powered analytics, anyone can go from question to answer.
For more advanced analysis, tools like ThoughtSpot Analyst Studio give data teams the flexibility to work in SQL, Python, or R without switching between platforms.
Every business question doesn’t need an AI model. Sometimes, a simple snapshot of what happened is all you need. Other times, you’ll need to dig deeper, forecast what’s coming, or figure out the best next move.
That’s why understanding the four types of analytics matters. It helps you match the question to the method and gets your team from gut feel to clear direction, faster.
With ThoughtSpot and Spotter, you don’t have to choose between speed and sophistication. You get both. Real-time answers, AI-assisted insights, and no waiting around for the next dashboard to be built.
See how it works—schedule a demo and start making decisions backed by data that actually moves with your business.
FAQs
1. Can I use multiple types of analytics in the same project?
Absolutely. In fact, most high-impact use cases blend multiple types. For example, you might use descriptive analytics to understand churn, diagnostic to pinpoint causes, predictive to flag who’s at risk, and prescriptive to recommend next steps.
2. What’s the biggest blocker to moving from descriptive to predictive analytics?
It's not always technology, it’s often trust and data readiness. Teams hesitate to act on predictive insights if they don’t trust the underlying data or don’t fully understand the models. Clean data and transparent methods go a long way.
3. How do embedded analytics relate to these four types?
Embedded analytics brings all four types directly into the tools your teams already use, like Salesforce, ServiceNow, or Google Sheets, so they can make data-informed decisions in the moment. With ThoughtSpot Embedded, you can embed search, Liveboards, and AI-generated insights right into apps and workflows, turning static interfaces into interactive decision hubs.


