


Picture this: You’re gearing up for an important client meeting, one that could make or break your next quarter. But instead of drowning in piles of outdated reports, you pull up a live dashboard. Instantly, you’re looking at this week’s sales, top-performing products, and real-time regional trends—all in one interactive view.
That’s the edge AI-powered dashboards deliver. They don’t just replay what happened; they show you what’s happening right now and, more importantly, why it’s happening.
Want to drive growth with every decision? Let’s dive in.
Table of contents:
A business dashboard is a visual tool that brings together key metrics and performance indicators into a single, interactive view. It turns complex data into easy-to-understand visuals, making it easier for you to spot trends, identify anomalies, and make quick, data-driven decisions.
Whether you’re monitoring sales performance, analyzing marketing campaigns, or keeping an eye on operations, these dashboards can be customized to focus on what matters most to you. The result? Real-time insights that help you stay ahead of the curve.
Real-time data monitoring: Imagine having instant access to the latest metrics. Business dashboards pull data in real time, so you’re always in the know and ready to act quickly on emerging trends and shifting conditions.
Data integration: Think about all the data you’re juggling—CRM contacts, social media metrics, sales reports. Now, picture it all in one place. Modern BI tools pull all your data together, so you can easily visualize it and connect the dots for smarter decision-making.
Interactive visualizations: When data is presented through dynamic charts, graphs, and heatmaps, understanding complex datasets becomes easier. Even better, you can click, filter, and drill down your data for deeper insights.
Customizable views: Whether you’re a sales rep tracking daily lead conversions or a marketing manager analyzing ROI, you can tailor your dashboard to focus on the metrics that drive your goals.
Alerts and notifications: Stop refreshing your dashboard every five minutes. Instead, set up automated alerts that notify you the moment a KPI drops or a critical metric hits the threshold. This agility helps you resolve issues before they hit your bottom line.
Export and sharing options: Need to keep your team in the loop? Share your reports and visualizations through email, PDFs, or live links to keep every stakeholder informed and engaged.
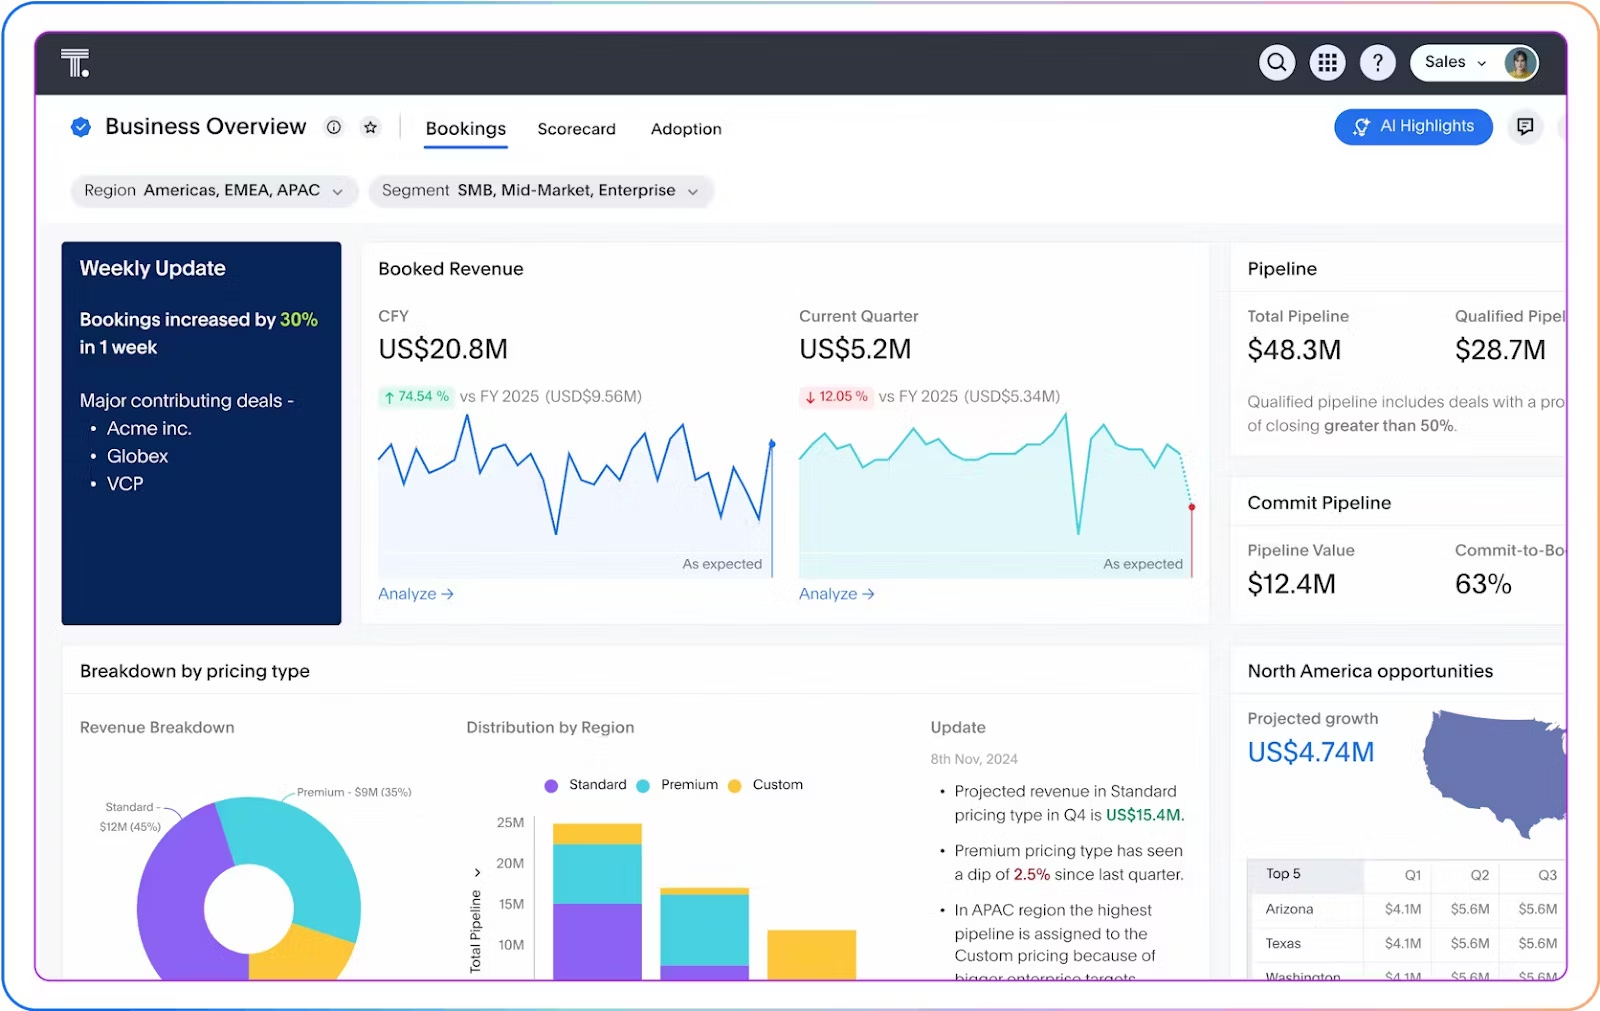
1. Sales dashboard
Have you ever looked at a sales report and thought, “I wish I could see which region drives the most sales?” or “What’s the cost of converting a lead into an actual customer?”
When used strategically, sales dashboards can answer those questions and more. They give you a clear view of key metrics like revenue, conversion rates, and sales growth over time. Armed with these insights, you can spot what’s working, double down on high-performing assets, and drive sales performance with precision.
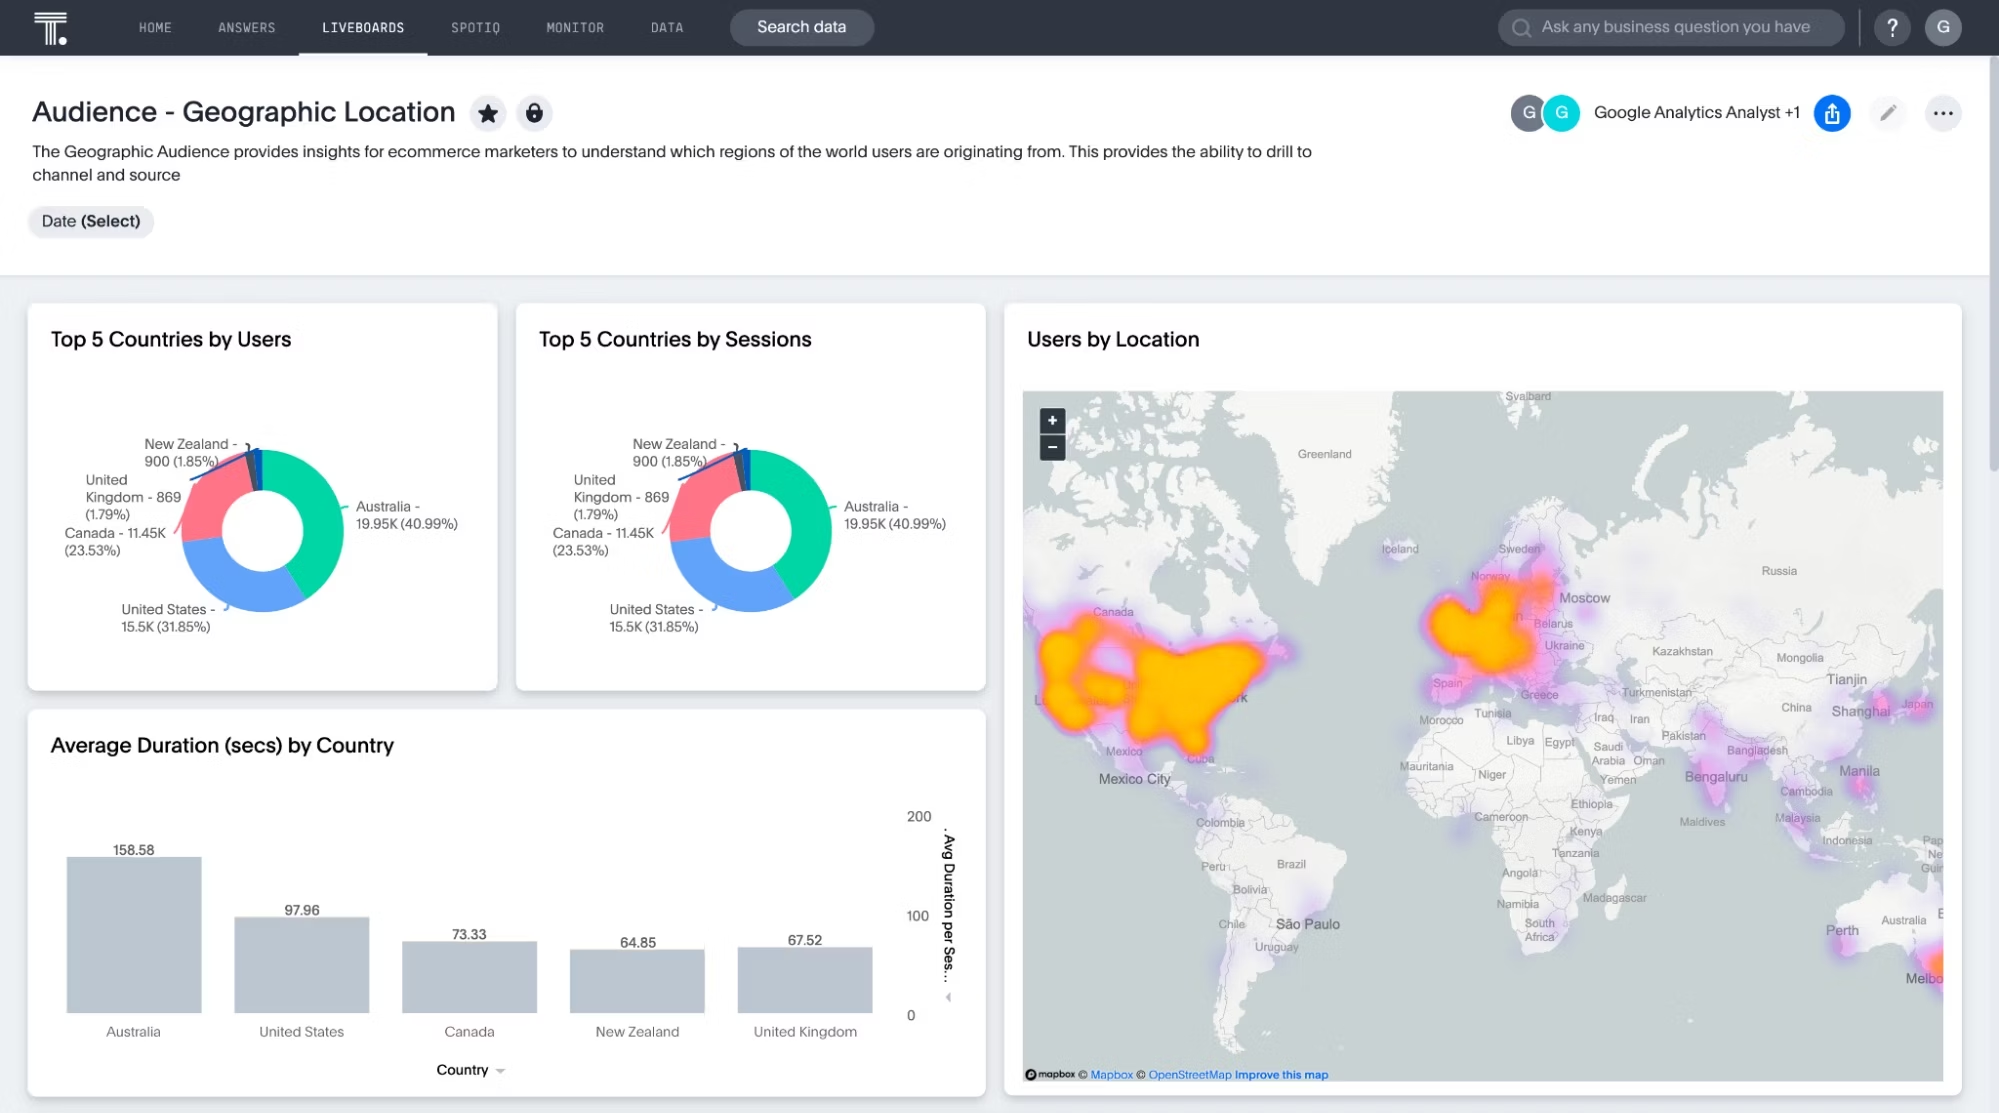
2. Marketing dashboard
As a marketer, you’re always juggling campaigns, channels, and shifting priorities. Marketing dashboards bring everything into one clear, comprehensive view, so you can keep a thumb on the pulse of your performance. By tracking critical KPIs in real time, you can see what’s resonating, spot gaps, and fine-tune your strategy to maximize impact.
3. Financial dashboard
Managing a company’s finances can be tricky. From complex financial data to factors that impact revenues, there’s a lot you need to keep track of.
With financial dashboards, you gain real-time, visual insights into key financial metrics like cash flow, revenue growth, and profit margins—all in one place. This can help you stay on top of your company’s economic health and take action when and where it counts.
4. HR dashboard
Your people are your biggest asset. With HR dashboards, you get up-to-date info about employee performance, empowering leaders to quickly identify workforce trends, areas of concern, and opportunities for improvement.
But don’t just take our word for it. Alana Roesler, End-to-End Data Flow Architect at Schneider, shares how she uses ThoughtSpot’s Agentic Analytics to drive real change in HR:
5. IT dashboard
As your organization embraces new cloud and AI technologies, your IT team needs a clear, real-time view of cloud workloads to keep everything running smoothly. With IT dashboards, they can track, analyze, and visualize tons of IT data, making it easier to spot bottlenecks, resolve issues faster, and cut down on the flood of support tickets.
Having explored various examples of business dashboards across different job functions, let’s look at how they can be applied across industries:
1. Retail dashboard
For retailers, keeping tabs on sales, finances, and inventory is non-negotiable. With retail dashboards, you’re not just tracking numbers—you’re getting a real-time snapshot of what’s driving your online business forward.
From spotting sales trends to managing stock levels, it’s all there in one clear, accessible view, empowering you to make smarter, faster decisions.

2. Healthcare dashboard
For healthcare professionals, data isn’t just numbers—it’s patient histories, clinical notes, and feedback. But when all that information is scattered across outdated systems, making sense of it can feel like a chore.
Modern dashboard tools change that. They bring all your patient data into one place, making it easy to analyze past records and create personalized care plans.
3. Telecommunication dashboard
Having a robust subscriber base is great, but to deliver quality customer service, you need to analyze usage at a highly granular level. With dashboards built for telecom, you can visualize crucial customer data, including call drop data, signal strength, and network latency, to identify areas with poor coverage.
For instance, by using ThoughtSpot’s agent-powered dashboards, every member of your team can swiftly discover trends and anomalies in their telecom data:
4. Manufacturing dashboard
The manufacturing industry is known for its complex processes and high-volume operations. Luckily, with interactive manufacturing dashboards, you get a bird’s-eye view of your manufacturing data. This visibility empowers you to minimize downtime and improve profitability.
For instance, you might use manufacturing dashboards to analyze expenditures across your operations and identify areas of improvement.
Operational dashboards
Think of these as your command center. Whether you’re monitoring sales orders, support tickets, or production output, operational dashboards keep you in sync with what’s happening in your business right now. With real-time operational insights, you’re addressing issues before they snowball.
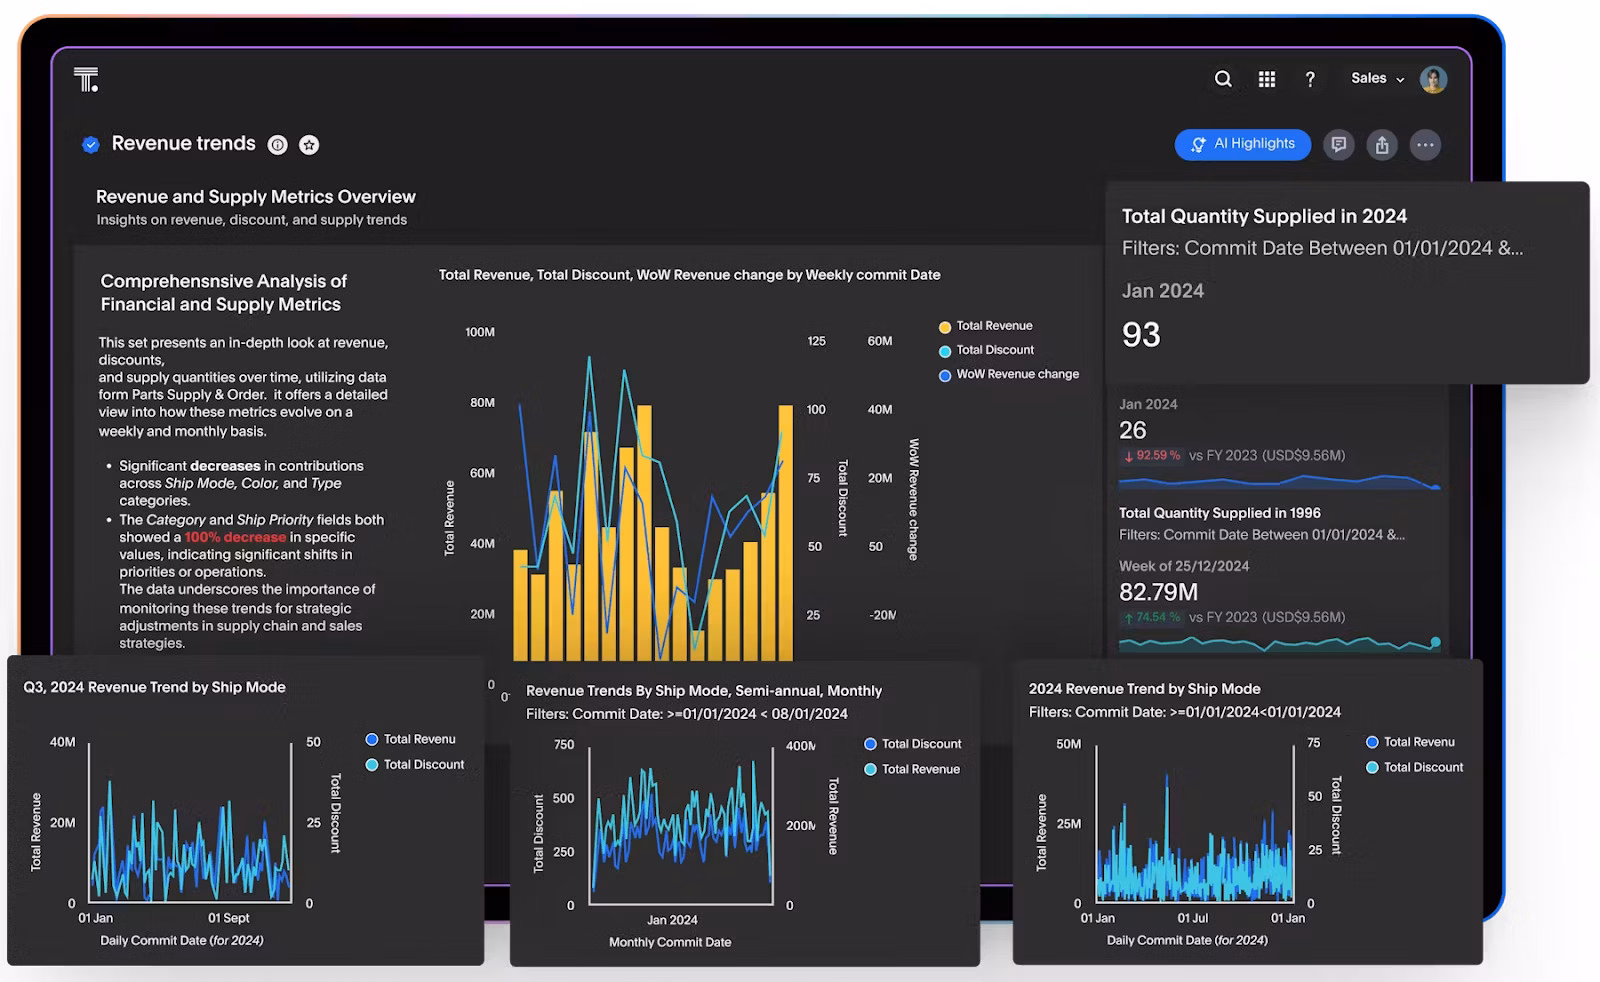
Analytical dashboards
When you need to dig deep and figure out the “why” behind the “what,” these dashboards are your go-to. Built for data discovery, they help you explore complex datasets, surface hidden patterns, and zero in on root causes.
Strategic dashboards
Strategic dashboards are all about the big picture. They highlight long-range KPIs—like revenue growth, customer acquisition, and profit margins—so you can track how your business is performing against high-level goals. Think of them as your north star for planning and progress.
Tactical dashboards
These laser-focused dashboards help you monitor short-term projects and team performance. Whether you’re measuring a campaign’s ROI, tracking this month’s sales goals, or managing project timelines, they deliver the granular insights you need to fine-tune quickly as you go.
1. Accessing real-time data
Forget sifting through outdated reports—you need real-time data. With dynamic visualizations, your team can keep a close eye on key metrics, spot trends as they unfold, and catch anomalies before they impact your bottom line.
For instance, if you’re running an e-commerce business, a custom e-commerce dashboard can show how visitors are interacting with your website in real time. Instead of reacting to yesterday’s data, you can adjust messaging, tweak campaigns, and optimize the user experience on the spot—driving higher conversions and faster wins.
2. Enhancing data exploration
Interactive dashboards do more than provide a quick overview. They give you the tools to dig deeper, connecting the dots between data points, time frames, and categories. With drill-downs and filters, you can move beyond the “what” and start asking the “why.”
For example, a customer-facing dashboard might reveal that churn rates spike for certain customer segments. But what’s causing these drops?
That’s where an AI Analyst like ThoughtSpot’s Spotter can make a difference. Instead of guessing, you can type in a specific question like, “What’s causing churn for X customers this quarter?” and get instant, data-backed answers that pinpoint the root cause.
3. Improving the bottom line
When you set up a custom business dashboard, you’re turning raw data into targeted strategies that protect margins, cut costs, and amplify ROI.
Prevent costly delays: Catch production bottlenecks as they happen to keep deliveries on schedule and prevent unexpected hits to your bottom line.
Anticipate customer demand: Instead of guessing when sales will spike, use past data to predict trends, adjust inventory, and tailor customer experiences accordingly.
Boost profit margins: Identify product strategies that are underperforming and redirect resources to the areas with the highest growth potential.
Take Austin Capital Bank, for example. By using ThoughtSpot daily to track lead generation and conversions, they were able to improve their revenue margin by roughly 30% and drive a 50% decrease in paid search spend.
A business dashboard isn’t just a collection of data points, it’s your go-to hub for tracking performance and making quick, informed decisions.
But here’s the thing: if your data is scattered or you’re using a clunky tool, it can take weeks just to get started. Reddit users have been there, warning how easy it is to get stuck in dashboard setup hell.

Let’s keep it simple. Here’s how to build a game-changing dashboard in five straightforward steps:
Define clear business objectives: What are the key metrics that drive your decisions? Focus on those. Whether you’re tracking sales growth, budget performance, or customer churn, zeroing in on specific outcomes makes your dashboard more relevant and actionable for your role.
Connect to relevant data sources: You don’t need every data point, just the ones that impact your bottom line. Pull data from CRMs, financial systems, and marketing tools. The more targeted your data, the faster you’ll spot actionable insights.
Pick the right tool: If the dashboard feels complex and too difficult to navigate, no one will use it. Look for a platform with a simple, drag-and-drop interface and pre-built templates that align with your workflow. And don’t sleep on AI-driven features like anomaly detection and natural language search—they can surface insights you might otherwise miss.
Design for clarity: Keep things simple and clutter-free. Complex layouts and too many KPIs can distract you from finding out what actually matters. Focus on simplicity to communicate vital information quickly. Match data types to the right visuals. For instance, use line charts for trends, bar charts for comparisons, and heatmaps to emphasize clarity. This keeps your visuals easy to interpret.
Launch, share, and optimize: Once your dashboard is live, get feedback from your team. Are they finding the insights they need? Is something missing? Regularly update your dashboard to keep pace with changing business priorities, so it stays relevant and useful.
Go from insight to action with agent-powered business dashboards
True competitive edge isn’t about tracking what’s already happened—it’s about spotting the next move before anyone else. Think of untapped customer segments, emerging product demands, and potential revenue leaks. Without real-time, actionable insights, these opportunities can easily slip through your fingers, costing you market share and momentum.
With ThoughtSpot, you don’t just get another dashboard, you get real answers. From executives to frontline teams, anyone can access instant, AI-powered insights without writing complex queries.
And the best part? You can keep digging. With Spotter, as your AI Analyst, you can keep asking follow-up questions to find insights that could shift your entire strategy.
Ready to see how next-generation AI-augmented dashboards can elevate your decision-making? Schedule a free demo today.


