


Here's the truth: data alone can’t fix broken decisions.
Consider your customer support logs: You're likely tracking metrics like average response times, occupancy rates, and ticket volumes. But are these snapshots really helping you see the bigger picture? Do you know why calls always spike on Tuesdays, or what triggers a flood of tickets after every feature launch?
Miss the what and why, and your decisions are just costly gambles.
That’s exactly why time series analysis is so powerful. It surfaces the hidden trends buried in your data, finally revealing the real story behind the numbers.
Let’s explore how.
Table of contents:
- What is time series analysis?
- What are the key components of time series analysis?
- Why does time series analysis matter?
- Top techniques for time series analysis
- Advanced methods for complex time series analysis
- Challenges of time series analysis and how to overcome them
- Practical applications of time series analysis
Time series analysis is how you analyze data collected in a specific order over consistent time intervals, like daily sales, monthly revenue, or hourly website traffic.
Unlike other data analysis methods that examine data points in isolation, time series analysis focuses on how data evolves over time. This allows you to accurately spot important business trends, seasonal patterns, and correlations.
And the best part?
You can also use this method for accurate forecasting. This means instead of just guessing what's around the corner, you're using past data as a powerful guide for what's likely to happen next.
For example, you might observe your sales slowly dropping every year after the holiday season—but that's a clear trend you can actively plan for.
Every time series dataset can typically be broken down into four fundamental components
Trend: Shows the overall path your data follows over time. It represents long-term movements that show persistent increase, decrease, or stagnation in the data.
Example: A gradual, consistent increase in annual sales over a decade.
Seasonality: Captures predictable patterns that repeat at fixed, regular intervals. These are often tied to specific times of day, week, month, or year.
Example: Daily spikes in website traffic or a recurring surge in retail sales every holiday season.
Cyclic patterns: Describes fluctuations that occur over longer, irregular periods, typically more than a year. These often reflect broader economic or market forces.
Example: A multi-year boom and bust in housing prices, or an industry-wide expansion.
Noise: Represents the random, unpredictable variations in data. Detecting these bumps helps you filter out distractions and stay focused on what really drives your data.
Example: A sudden, one-time spike in calls due to a breaking news report that doesn't fit a pattern.
Optimized resources
When your supply chain can’t keep up with demand, you feel that pressure everywhere. Overstocked warehouses tie up valuable capital, empty shelves turn into missed sales, and your delivery fleet burns cash due to last-minute, inefficient trips. These aren’t just minor inconveniences; they’re a direct hit to your profitability.
Time series analysis helps you spot these patterns before they drain your bottom line. By revealing trends and seasonal swings in orders, shipments, or lead times, it shows you exactly when to ramp up production, stock up inventory, or scale back.
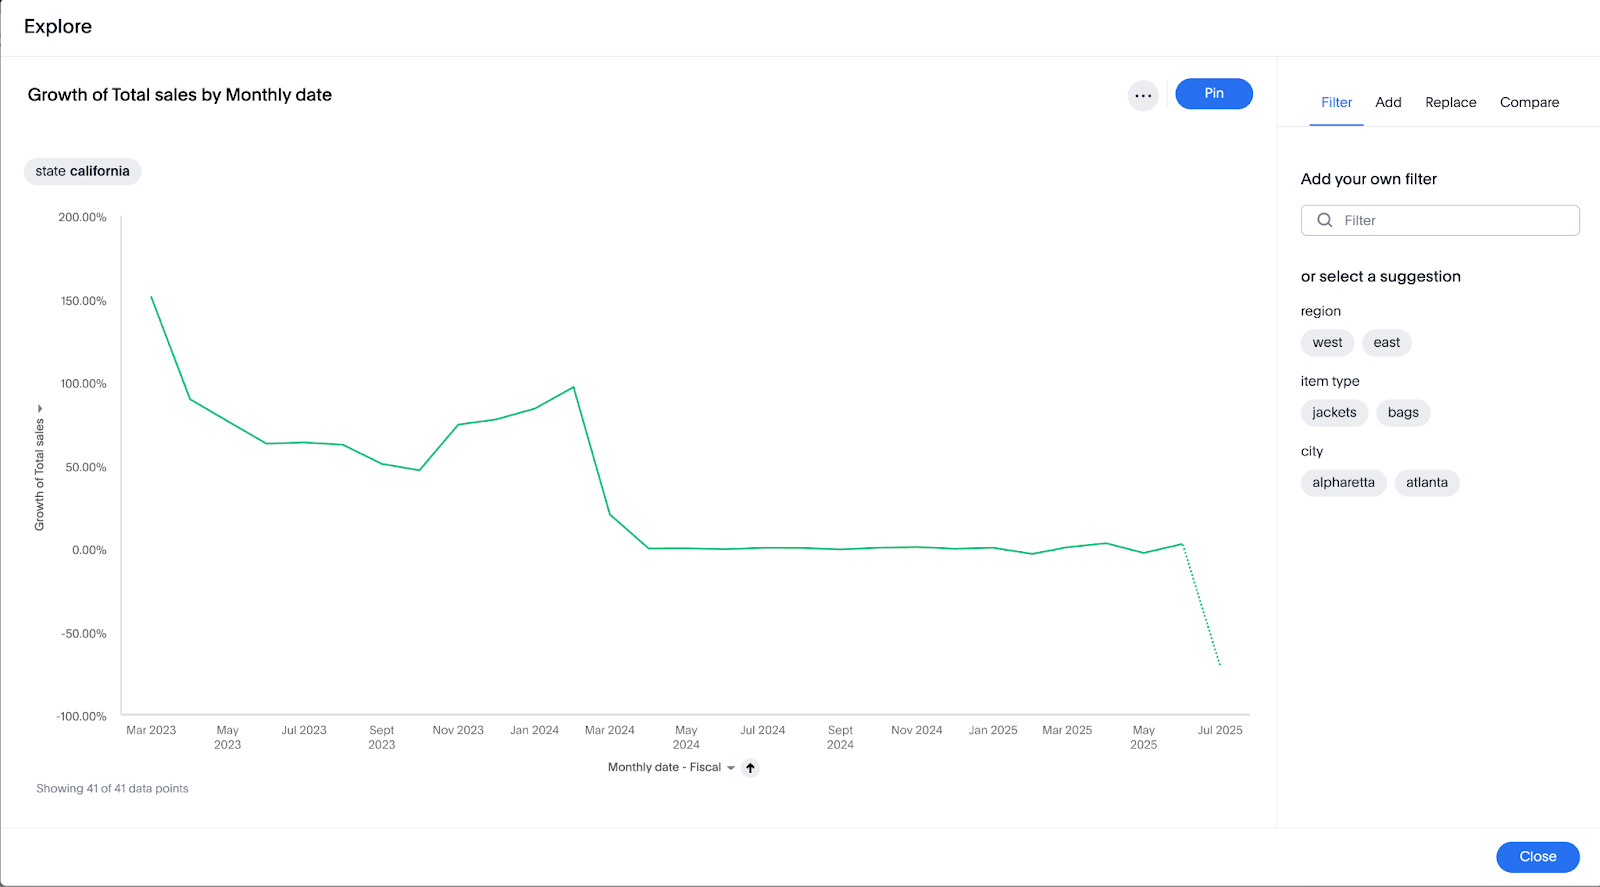
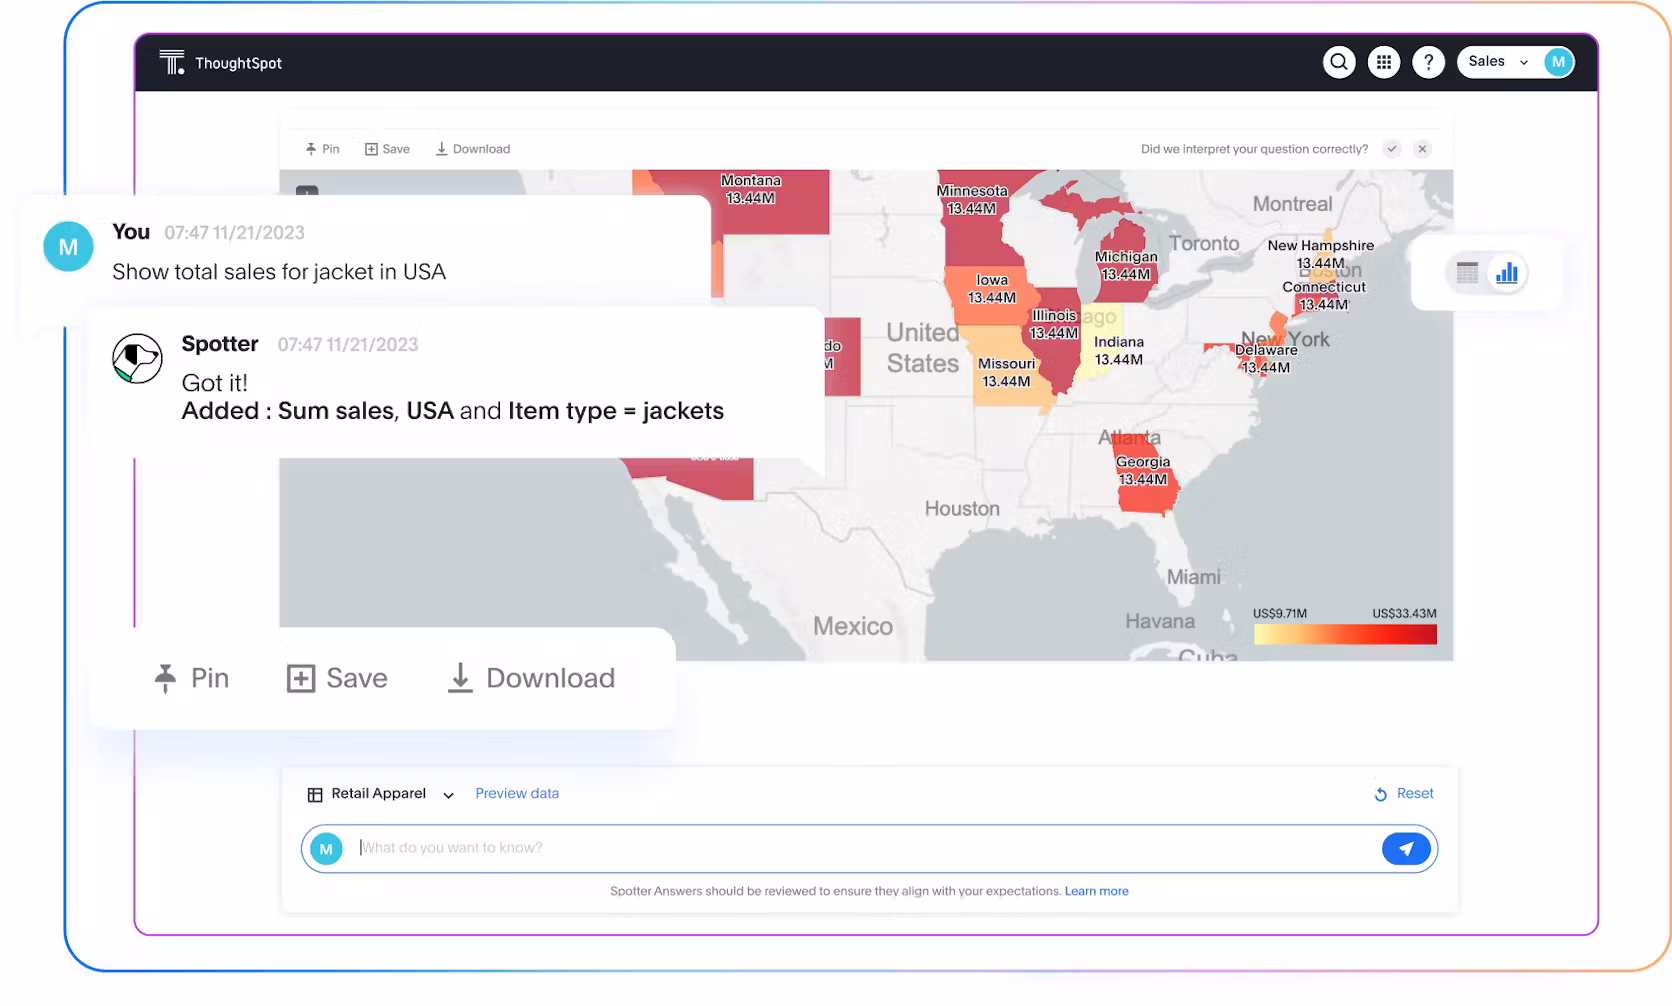
And with Spotter, ThoughtSpot’s AI Analyst, you don’t need to spend hours digging through spreadsheets. You just ask, ‘When do we see supplier delays spike?’ and get an answer in seconds.
Insights like these empower you to free up tied-up resources and strategically redirect them to areas that drive real value.
Discovering hidden correlations and anomalies
Without truly understanding the flow of your data, you're essentially making big decisions based on incomplete information. That's a risky game to play.
So, how do you move past those data blind spots? By leveraging techniques like decomposition and visualization, you gain a complete view of your data that illuminates:
Clear, actionable trends: Understand the trajectory of your key metrics.
Hidden correlations: Discover unexpected relationships between different data points.
Critical anomalies: Quickly pinpoint unusual occurrences that demand immediate attention.
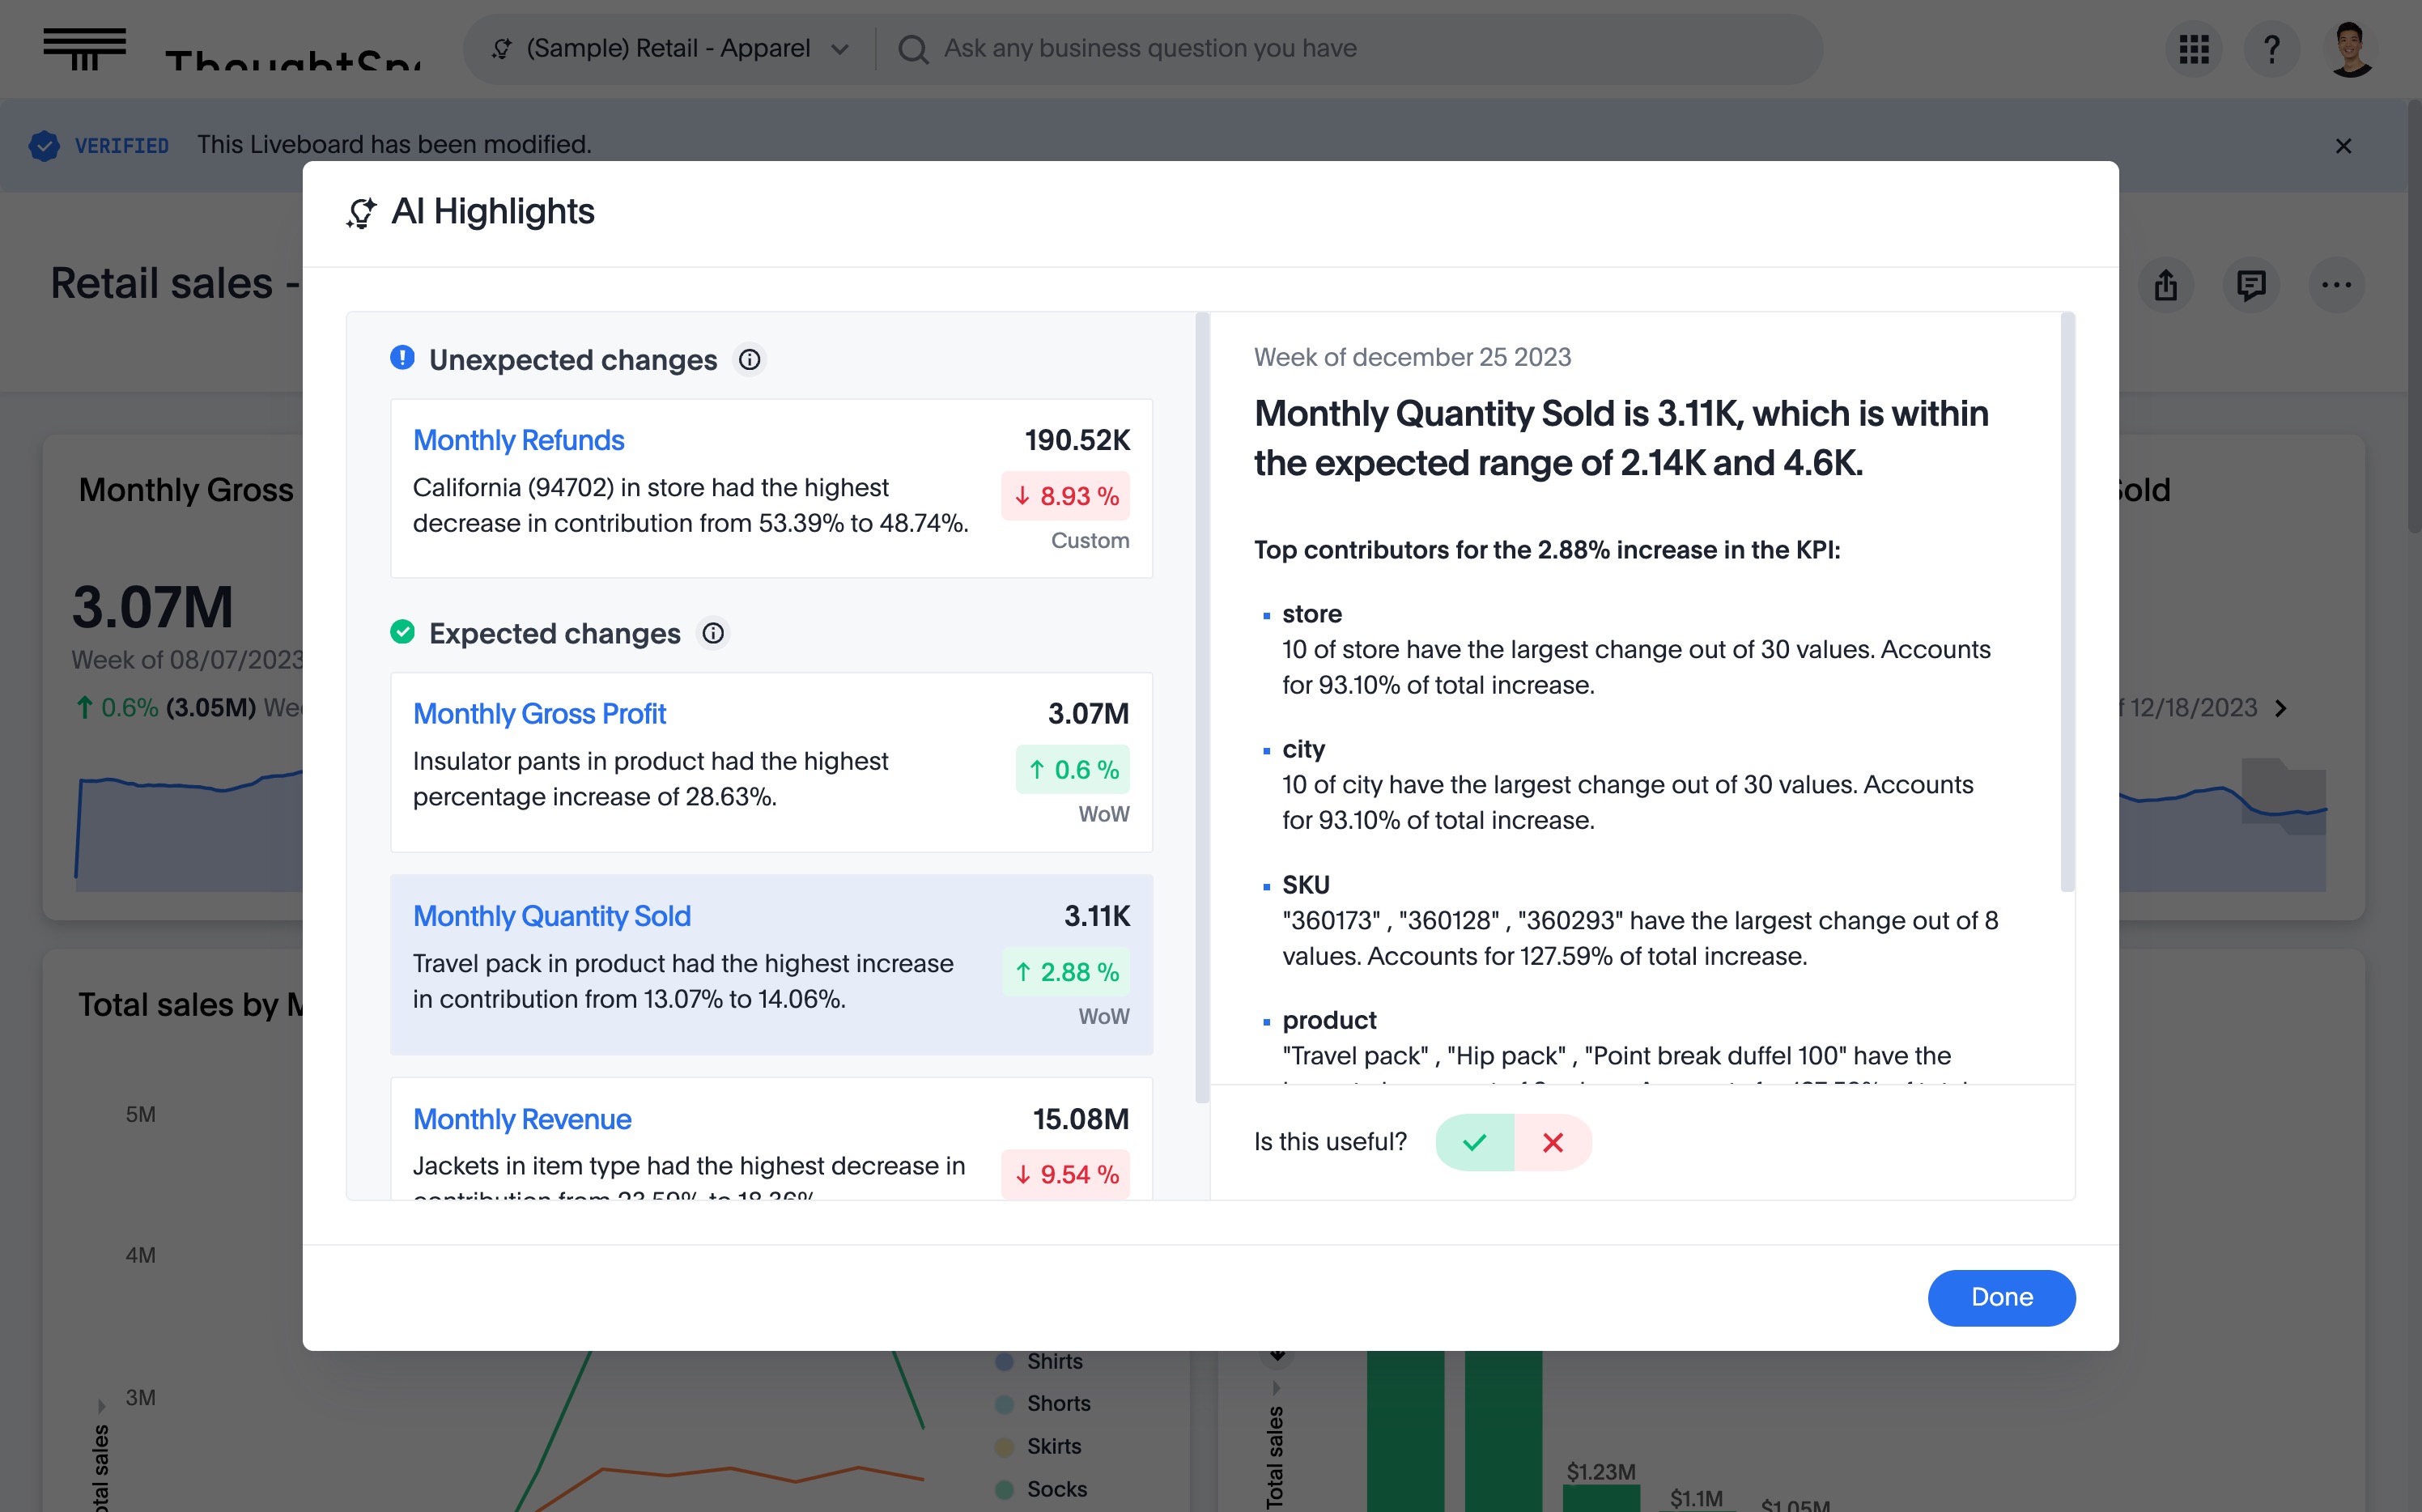
Even better, with ThoughtSpot’s Trend Analysis, you gain automated insights into your data. You can stay on top of unexpected changes thanks to automated anomaly detection. Plus, you can dig deeper into the root cause behind KPI fluctuations via automated change analysis. Together, these features turn your dashboards into a powerful, actionable business intelligence engine.
Better predictability
How do market leaders always seem to know what's coming?
Think about it: Power companies are prepared for heat waves before the temperatures soar. Airlines know exactly when peak travel days will surge. E-commerce brands stock up for big sale weekends long before the flood of orders hits.
That level of foresight isn't based on gut feelings; it’s backed by in-depth predictive analysis.
By deploying powerful time series models such as ARIMA and Exponential Smoothing, you can convert your past data points into dependable forecasts, giving you the edge to anticipate and act with confidence.
There’s no one-size-fits-all approach to time series analysis. What will work best for you really depends on the data you have and the problem you’re trying to solve. That said, here are a few common techniques you can leverage to get started:
| Technique | What it does | Why it matters |
|---|---|---|
| Moving averages | Smooths out short-term fluctuations by calculating the average of values within a moving time frame. | Filters out daily noise so you can see important trends underneath. |
| Exponential smoothing | Gives more weight to recent data while still considering older data. | Lets you spot sudden changes faster. |
| ARIMA (AutoRegressive Integrated Moving Average) | Combines autoregression, differencing, and moving averages to find patterns and relationships in time-based data. | Shows how your data depends on its past, helping you understand underlying trends and make more confident analyses. |
| Seasonal decomposition | Breaks a time series dataset into separate trend, seasonal, and residual (noise) components. | Makes it clear what’s driving changes, allowing you to tackle important patterns faster. |
| Explorative analysis | Looks at your data from different angles to find patterns, outliers, and relationships. | Helps you understand the overall structure of your data before deciding how to model it. |
| Forecasting | Uses historical patterns to estimate what might happen in the future. | Lets you plan ahead with more confidence instead of relying on guesswork. |
| Visualization | Turns raw data into interactive visuals, such as charts, graphs, and plots, to reveal intricate patterns. | Makes complex data easier to interpret and explain to others. |
| Statistical models | Uses statistical techniques like hypothesis tests, regression, or machine learning to analyze time-based relationships. | Adds rigor and structure to your analysis, helping you validate insights and support data-driven decisions. |
💡 Think of these techniques like a toolkit. You won’t use every tool for every problem, but knowing which ones to use when can help you truly understand your data before you act.
These are broader, more advanced approaches and frameworks that can help you tackle complex analysis:
| Method | What it does | Why it matters |
|---|---|---|
| SARIMA (Seasonal ARIMA) | Extends ARIMA by adding seasonal components to handle complex, repeating cycles. | Useful when your data has seasonal patterns. |
| Holt-Winters Method | Builds on exponential smoothing to account for both trends and seasonality. | Great for data with regular seasonal peaks and an overall trend analysis. |
| Vector Autoregression | Analyzes multiple time series datasets to find how they affect each other simultaneously. | Shows how changes in one variable impact another over time. |
| Fourier and Wavelet Transforms | Breaks down complex, noisy signals into simpler, periodic parts. | Helps you detect hidden cycles that aren’t obvious in raw data. |
💡 These advanced methods are like the next level of your toolkit—perfect for when your data reveals strong seasonality, complex interactions, or hidden cycles that demand more visibility.
Outliers
Imagine you run a thriving e-commerce site. Suddenly, one of your products explodes across social media, going viral overnight. For three exhilarating days, orders spike dramatically, only to plummet back to normal levels just as quickly.
Outliers are tricky because they’re rare, but if you don’t catch them, they can skew your entire model.
⚒️ Fix: Visualize your data first. Use different types of charts like boxplots or scatterplots to catch extreme values, then run statistical tests to confirm hypothesis.
Non-stationarity
As you know, businesses are dynamic entities, and underlying trends rarely remain static. Consider a scenario where your sales show steady growth, only to abruptly shift after you expand your product into a new market. What was a reliable pattern last year suddenly no longer holds true.
Ignoring such fundamental shifts can lead to inaccurate forecasts and flawed insights.
⚒️ Fix: Use transformation techniques like differencing, log transformations, or seasonal adjustments to stabilize your data.
Data quality issues
Time series analysis relies on accurate, consistent data, but when you’re pulling from multiple sources, you can end up with missing timestamps, duplicates, or format inconsistencies. Even seemingly minor errors can escalate, corrupting your entire analysis and leading to flawed conclusions.
⚒️ Fix: Build validation steps into your data pipeline. Automate checks for missing or duplicate data, and clean inconsistencies before you start modeling.
Volume and granularity
Time series data, especially from sources such as clickstream logs or vast IoT sensors, can generate millions, even billions, of rows in mere moments. Attempting to store, process, and visualize this immense volume quickly overwhelms your data analytics system. This often leads to painfully slow analysis, system crashes, and unreliable insights.
⚒️ Fix: Aggregate your data to a reasonable time unit and choose an advanced analytics solution that can handle the depth and complexity of your data.
Finance
Imagine you're at the forefront of an investment firm, tasked with forecasting volatile stock prices and managing market risk. Time series analysis doesn’t just look at last week’s numbers; it studies decades of price history, uncovers hidden volatility patterns, and tests whether those patterns repeat under certain conditions.
And with anomaly detection, you gain an even sharper edge: instantly flagging sudden, unexpected price swings that could signal a market-moving event.
The bottom line? This advanced data analysis empowers you to spot crucial market signals long before your competitors even perceive them.
Procurement
Procurement teams have to source raw materials from multiple suppliers worldwide. A lot can go sideways: supplier delays, unexpected cost spikes, or sudden surges in demand from the business. Relying on last quarter’s averages won’t help you plan for what’s really coming.
Time series models like ARIMA and seasonal decomposition can show, for instance, that your main supplier’s lead times always stretch during the holiday rush, so you can switch orders earlier to a backup supplier to stay on track.
This in-depth analysis gives you a data-driven edge to manage risk, build supplier trust, and negotiate from a position of power.
Telecom
In telecom, time series analysis is the backbone of managing network performance and reducing customer churn. Imagine monitoring millions of call records and data usage points every minute—that’s a lot of moving parts.
Time series methods are crucial for understanding precisely how network performance fluctuates across different regions. For instance, they can reveal steadily rising 5G demand in specific areas, or predictable seasonal surges in evening data usage.
With such actionable insights, you can stay far ahead of network issues, proactively deliver a superior customer experience, and consistently keep your customers satisfied.
Make your next move your strongest yet
Staying competitive isn’t easy: markets shift overnight, customer demands evolve, and a blind spot can cost you everything.
But with ThoughtSpot’s Agentic Analytics Platform, Spotter becomes your AI Analyst, fundamentally changing the way your team operates. You can ask complex questions using natural language, perform sophisticated analysis effortlessly, and even embed autonomous agents directly into the tools your team uses every day.
While competitors are wrestling with static reports, your team will be acting on real-time, actionable insights, consistently staying several steps ahead.
Get the answers you need now—Try ThoughtSpot today.
Frequently asked questions
What is a time series?
A time series is a sequence of data points collected over time, typically at regular intervals. Each data point is indexed by the time at which it was recorded. Examples include stock prices recorded daily, hourly temperature readings, or monthly sales figures.
How does time series analysis differ from other methods?
This data analytics method differs because it specifically handles data points that are dependent on each other over time. Unlike most statistical methods that assume data independence, time series models account for the fact that a value at one point is influenced by previous values.
What’s the difference between time series analysis and forecasting?
Time series analysis is about understanding past patterns in time-ordered data (like trends, seasonality). Predictive analytics techniques like forecasting use these insights to predict future values.
What are the different types of time series analysis?
Time series analysis broadly involves two main approaches: descriptive/explanatory and predictive. Descriptive analysis focuses on understanding past patterns within the data, such as identifying trends and seasonality, often through methods like decomposition.
Forecasting uses the insights gained from understanding these past patterns to predict future values of the time series. This involves building models, such as ARIMA, Exponential Smoothing, or various Machine Learning models.


